 |
||
|
||
| ||
|
||
|
||
| ||
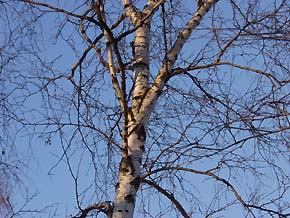
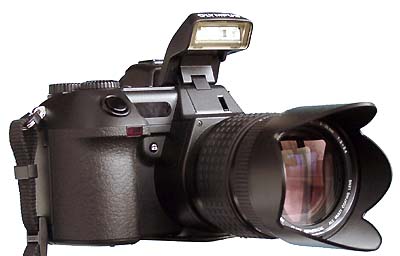 It is a newest camera in all respects. First, it has a 4-Megapixel CCD matrix, and second, it is the first specially developed digital reflex camera with a possibility of manual focusing on a lusterless screen. The camera looks is massive considering its weight and dimensions. The camera is equipped with a fast lens with 4x focal length, 9-36 mm, and with an lens aperture equal to 1:2 1:2.4. 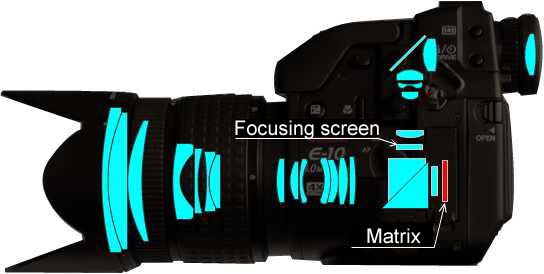 There are also additional afocal attachments: 3X telescopic TCON-300 (F:2.8), 1.45X telescopic TCON-14B(F:2.4), 0.8X wide-angle WCON-08B (F:2) and an adapter macro lens MCON-35 (F:2 -F:2.4). The camera knows about these attachments, and with some changes in menu the automatics will work the required way. 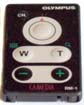 A focal length can be changed manually by turning the zoom ring (focal length values are written on a rim of the ring). Such construction is very convenient, though I wish the length could also be changed with a standard remote control. But this device seems to be designed only to work with a a release-button. A turning LCD can be used as a viewfinder, though it is a bit stripy. The majority of operations are done with buttons and switches located on a case. 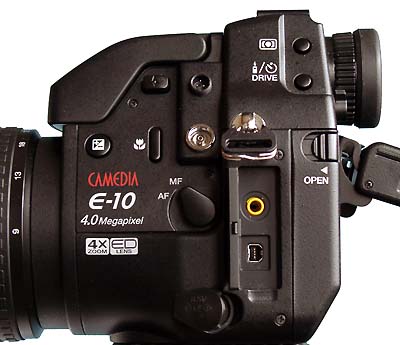  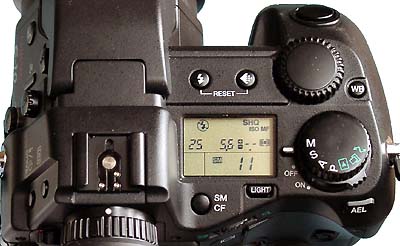 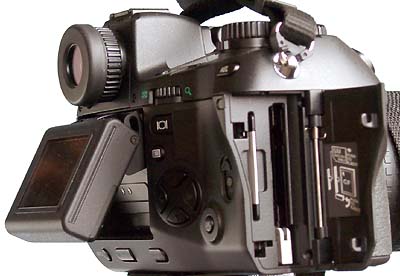 In order to get a detailed pictures click the photos to enlarge Therefore, there are not so much functions in the menu.     Menu functions are clear but for displayed "3/3". According to the manual it is a volume level of imitation of release-button work and a volume level of preventive signals. The camera is supplied together with a user's manual covering 204 pages. Information on shooting parameters can be seen both on an LCD display and in a viewfinder.   You can get also the comprehensive information on a captured image. 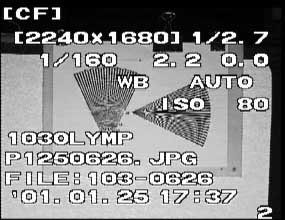 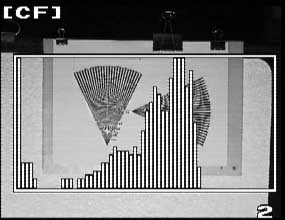 Manual focusing is accomplished by turning a focus ring on the lens, which doesn't however directly moves the lenses but switches on a motor drive. That is why there are only two 2 values: closer - farther. Such focusing system is used since the lenses have to be additionally moved in order to keep an image sharp when a focal length changes. The focal length is displayed on an LCD display. An image between a matrix and a focusing screen is divided by a light-splitting cube with a semitransparent surface. The camera worked perfectly in automatic mode. However, the distance from an object displayed on the screen confused me. A comparison of values on the LCD display and a distance obtained with a tape-measure showed that the focal length is measured from a point lying a bit in front of a front lens. In a film camera the length is measured from an image plane. 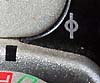 On decent cameras there is a mark on a case from which the distance is measured (see the photo). Further, we turned to a manual focusing with a focusing screen. Here we obtained data which were considerably different from those obtained with automatics. They depended on the selected focal length. At F=9 mm, when an object, located more than 100 meters away, was clearly seen on the focusing screen, the camera displayed only a 5 m length, and a captured image was not sharp. After that we tried to focus on an object situated 1 m from the front lens. With automatic focusing the camera displayed "1 m" and gave out a sharp shot. When we tried to focus manually so that an object was clearly seen on a focusing screen, the camera displayed "0.5 m" and the image wasn't sharp again. When focusing with the LCD display the focal length was close to that given by automatics and an image was sharp enough. Note that we used a radial resolution chart as a test-object and tried to obtain the best moire possible on an image. Such disagreement of results can be caused only by an unadjusted focusing screen. Because if you are using autofocusing and then you are switching a manual mode (not touching a manual focusing ring), an image will be absolutely sharp regardless of how much a focal length is changed. In fact, a lens-matrix unit doesn't require special adjustment, it's necessary only to ensure a sufficient range of lens moving. Moving the lens within it we can always get an object into a focus whatever the distance is. Adjustment is necessary to bring a scale value on the screen to conformity. A possible adjustment technique is the following: an object is placed in front of the camera at a specified distance and a special autofocusing program starts in order to secure a sharp image on the matrix. The obtained position of the lens is registered to the distance displayed on the screen. Now we have to get an optical path from the lens to the focusing screen through a lightsplitting cube to be equal a distance from the matrix. But a displayed scale is quite rough and it's difficult to focus the camera for the specified distance. A reading error will be 10 cm at the distance equal to 1 m, and when setting the camera to infinity the lens can overtravel the focal length. A rational solution consists in setting the camera (on a program level) to a value, which is considered to be infinity for this camera, and then moving a focusing screen until a sharp image appears in the viewfinder. But there are no any adjusting screws for moving a focusing screen and a button for moving the lens to a mode corresponding to infinity. Maybe one should disassemble the camera to accomplish it. Well, the fact is that they have forgotten to adjust this camera or it has fallen during transportation. An additional test of two Olympus E-10 cameras for identical results of focusing in manual and auto modes showed well matching results. That is why the camera we had should be considered an exception. Nevertheless you should check adjustment quality when buying such a camera. The captured images can be stored in SmartMedia and CompactFlash (type 2) cards. However, work with an IBM microdrive is not guaranteed. A module for batteries allows to use both CR-V3 and standard AA batteries. 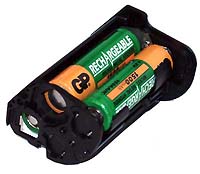 Test results
Resolution
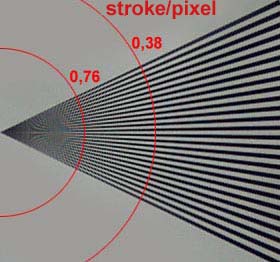 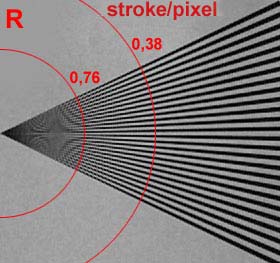 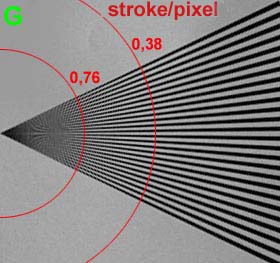 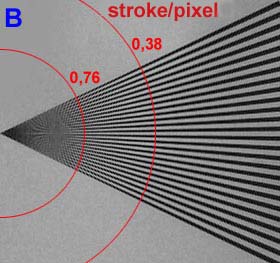 The best resolution is obtained in a green channel. It doesn't differ from 3-Mpixel cameras in a number of pixels for one stroke, but since a frame is bigger we have 1800 vertical by 1350 horizontal strokes per frame. A black and while lines make two strokes. Spectral characteristics It is a shot of a spectrum of a halogen lamp KGM250 obtained with a gitter. A while line corresponds to 632.8 nm wavelength. The photos are made with 1/2 s exposure and 2.8 aperture. The spectra show that there are zonal red, green and blue filters in front of the matrix, and it is necessary to overexpose the shot to get clear yellow and cyan colors. Characteristic curvesIn order to get a high quality snapshot you must have a film with predictable characteristics. Film manufacturers conduct a great deal of sensitometric tests. And while the majority of users are interested only in a film sensitivity, the tests are carried out for a lot of different parameters. We have tried to conduct our own sensitometric tests for the camera's matrix. First I should explain some terms and how they implement such tests in a classic photography. A modern sensitometry includes techniques for determination of a contrast factor, fog density, spectral sensitivity, resolution etc. A graph of the relationship between the amount of exposure given a film and its corresponding density after processing is called a characteristic curve. For each film a family of such curves must be obtained. A family will be complete if a characteristic curve is known for any combination of a developer, time and temperature. A black-and-white film requires nearly 300 curves. A speed at which an optical density changes depending
to exposure is one of the key characteristics. It is a contrast
factor and it is marked as ExperimentWe conducted a shooting of an object which has a lot of uniformly illuminated planes. The object was illuminated with daylight and with a halogen lamp. 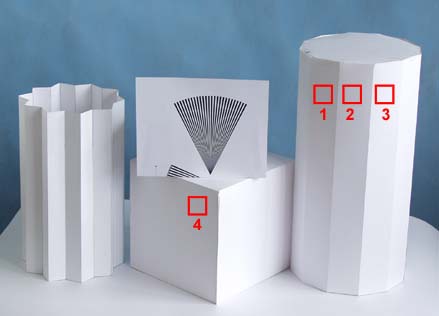 Exposure and aperture were altered. For areas in red frames we plotted graphs of brightness of pixels vs. exposure conditions. So, we have got a family of characteristic curves for different sensitivity values of the matrix. Further we will show that in our opinion matrix's sensitivity should be called an exposure index. As the areas are illuminated uniformly, spread in values of pixel brightness was used for estimation of signal/noise ratio.  Logarithm of pixel brightness vs. logarithm
of shot time. Measurements for area #4. We have plotted a graph of the relationship between a logarithm of brightness of pixels from area # 4 and a logarithm of shot time (in an interval between pixels exposure changes by a factor of two). So, a tangent of a slope angle is an exponent. We have obtained the following contrast factor's values for a linear part of the curve:
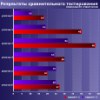
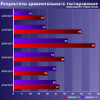
A contrast factor is defined as a tangent of a slope angle of a line connecting two pixels which differ in exposure by a factor of 16. Sensitivity in ISO is determined with a standard characteristic curve and is equal to 0.8 / H, where H (logarithm of exposure in lux*s) corresponds to 0.1 density above the line "Optical fog density". The problem is that a characteristic curve is considered to be standard if an optical density between 0.1 and 0.9 above the "Optical fog density" line changes in case of the logarithm of exposure is altered by a factor of 1.3. It means that a contrast factor for this curve (a dotted curve on the plot) must equal 0.615. We assume that a logarithm of brightness of pixels in digital image is an analog of an optical density of a developed light-sensitive layer. Changing amplification of a signal from the matrix (changing ISO in the menu) we can't get a standard characteristic curve, and therefore estimate sensitivity by a standard way. Such a case has already took place. And sensitivity in ISO, ASA, DIN, GOST is not determined for special-purpose films such as high-gamma, X-ray and infrared films. In such cases manufacturers usually specify an exposure index, which should be used for determination of the corresponding exposure when a light level is determined with exposure meters calibrated in ISO,.... So, manufacturers give an exposure index with which one can define an exposure and aperture with a standard exposure meter. The above graphs can also be used to determine a dynamic range at different amplification (an exposure index) and at different illumination (daylight, incandescent lamp). For ISO 80 and daylight a dynamic range is equal to 10 in 2.7 power, what corresponds to a tonal range in 9 steps. At lamplight it is reduced down to 8 at ISO 80, and at ISO 320 - down to 7. At daylight with increase of sensitivity the reduction of a dynamic range is not so noticeable, however a linear part of a characteristic curve becomes shorter. It means that a latitude depends much more on sensitivity and frequency content of the light than a dynamic range does. Whether 7 exposure steps or 128/1 - ratio of brightnesses of an object is much or little is for you to judge. The max ratio of brightnesses in a sunny day outdoors can reach 1000/1. If we consider a light reflected from a glass surface and a completely black tone, the contrast will be about 160/1. A ratio of brightnesses on a beach in a cloudy day makes 10/1. Now let's study characteristic curves for each channel. The lowest contrast factor is in a blue channel at lamplight and in a red channel at daylight. A contrast factor in a green channel is nearly independent of sensitivity and a light source. On the whole, the curves are similar, and only in a shadow area a difference is noticeable.   DL - daylight, IL - incandescent lamp. And at last comes a logarithm of a signal/noise ratio vs. a signal. The maximum noise is in a blue channel at lamplight.  White balanceDetailed experiments which show how the camera implements color correction were conducted by Sergey Sherbakov. The results of the experiments are shown here. Photo examples
 miniature 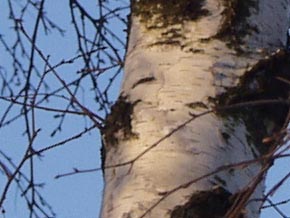 fragment  fragment Technical characteristics
Write a comment below. No registration needed!
|
Platform · Video · Multimedia · Mobile · Other || About us & Privacy policy · Twitter · Facebook Copyright © Byrds Research & Publishing, Ltd., 1997–2011. All rights reserved. |