 |
||
|
||
| ||
|
||
|
||
| ||
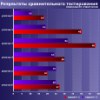
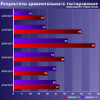
The issue of diminishing Pentium 4 CPU performance at overheating has been widely discussed (see, for example Intel Pentium 4 1.6A GHz Overclocking, Thermal Monitor). Still, there are all sorts of myths about the Thermal Monitor and Thermal Throttling technology. That is why we decided to refresh our practical knowledge in this field (dropping the theoretical aspect which is abundant in the above-mentioned articles). For this purpose, we conducted a very simple experiment on two top Pentium 4 3.2 GHz CPUs, one with a Northwood core and the other with a Prescott. With the CPU loaded at 100 percent, we powered off the cooler fan and watched the temperature rise and the performance decrease as time went by. This article gives an account of the experiment and its results. Testbed
To reach a full load of the CPU (or to be exact, of two virtual CPUs, as Pentiums 4 we took support the Hyper-Threading technology), we used a CPU Stability Test from the latest version of CPU RightMark. This enabled us to see the dynamics of CPU performance. It should be noted here that as Thermal Throttling doesn't change the Pentium 4 core frequency, it is performance that we should focus on. As for temperature measurements, we used a quite popular Motherboard Monitor program version 5.3.6.0. Its window (or "Dashboard", to quote the authors) was placed beside CPU Stability Test window (or even overlapped it). Now we would like to dwell a bit on the choice of the motherboard. To make it a typical case, we chose a model that has no Thermal Throttling control options in BIOS Setup. Thus, we reproduced the situation where there is no manual control of the process and everything works according to the default settings. TestingFurther report is represented in the form of screenshots that illustrate stages of the experiment as they went. The screenshots are also supplied with our comments. Pentium 4 3.2GHz "Northwood" Starting position: the system was booted and has been idle for 10 minutes. Ambient temperature is 22°C; the chassis is opened. As you can see, CPU temperature is 34°C.  RightMark CPU Stability Test is run. Time: approximately 5 seconds after the start. The temperature has risen by 8 degrees, performance graph has appeared in the program window. The graph can be described as flat. Note that Multimedia Timer - the most inaccurate way to determine performance - was toggled off in Stability Test options. We only left Performance Counter and Time Stamp Counter graphs. But you can notice a green line of Multimedia Timer graph, which runs at zero level on the Y-axis (zero level indicates it is toggled off). You can also see that the red Time Stamp and the yellow Performance Counter lines have practically merged into one.  6 minutes since the start. CPU temperature has finally stabilized at 50°C, though momentary bursts up to 51 or 52°C occur now and then. The graph line is flat, as performance doesn't change; Thermal Throttling (hereinafter referred to as just "throttling") is off. 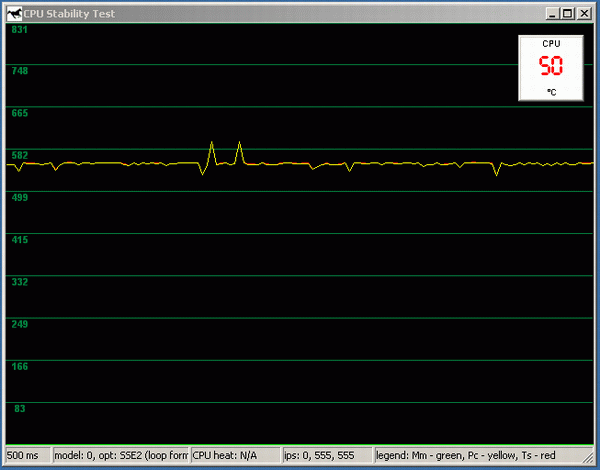 After a screenshot was captured - which was an additional load for the CPU - the graph started giving slight recurrent spikes. But this can hardly be accounted for by throttling. The most probable explanation seems to be that other processes in the system began to interfere into performance-assessment efforts by RightMark CPU Stability Test. And this, in fact, shows that in a multi-task OS results of performance measurements are very unlikely to be perfectly stable. So, this screenshot is mainly for those willing to repeat our experiments. It is to show you that you don't need to worry about such spikes, as they are normal. 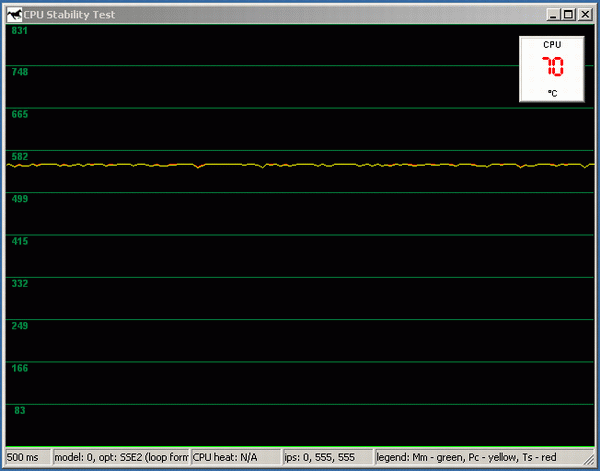 A minute since the cooler fan was off. The temperature has risen by 20 degrees (note that it took as long as a whole minute of CPU working at 100 percent with a stopped fan). Throttling is off as the CPU is still trying to keep performance at the initial level.  67-70 seconds since the fan was off. The temperature has risen by another 4 degrees and the CPU is starting to throttle. Note the first two spikes of the graph, they indicate CPU's weak efforts to return back to the normal state. But these efforts stop in a relatively short time span. 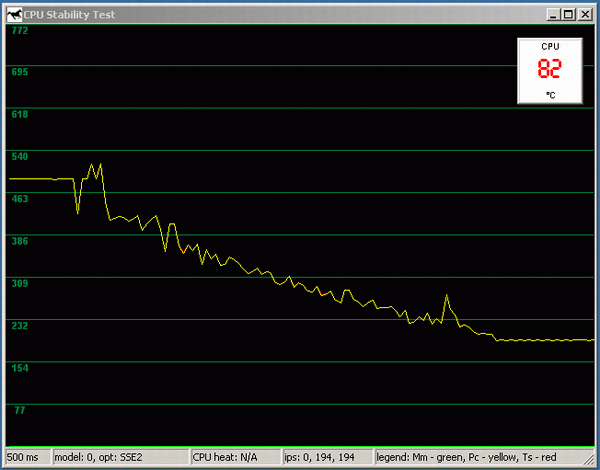 This is a typical picture of how throttling begins. The screenshot was captured in another iteration as capturing the previous one had sort of "spilt" the graph quite significantly. However, time intervals and temperatures still repeat, with a quite high precision of plus/minus 3-4 seconds and 1-2 degrees. All in all, it takes about 20-25 seconds to reach the final stage since throttling begins. During the process, performance goes down by approximately 50 percent. CPU is "fully throttled" at around 80°C. 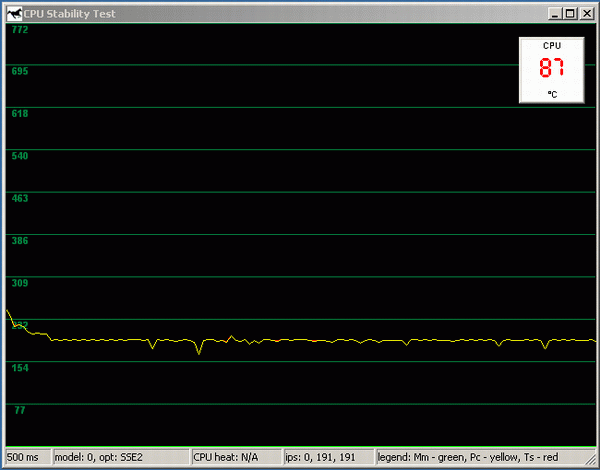 Now that the temperature continues to rise and performance has stabilized, we are going to conduct another experiment: we are turning on the fan once again.  This screenshot, either, wasn't captured during the same experiment, but that makes no difference. We only need to see the throttling ending and to note the time. It takes Northwood about 5-7 seconds to do that, after which it returns back to normal performance in the same stepwise way it has gone down. The graph is stabilized at around 70°C - the same temperature we saw when CPU's work was stable with no throttling and the fan off.  And now we have come to the promised apotheosis. A couple of seconds before the system's shutdown; the temperature is 94°C. In our case (ambient temperature 22°C, opened case), throttling couldn't save the CPU from overheating, which lead to a thermtrip and caused the CPU to shut down (though not to burn). We repeated the test 10 times in a row with the same result. In the case of Pentium 4 3.2GHz Northwood the "last breath" temperature was around 94 to 98°C, according to Motherboard Monitor. Pentium 4 3,2E GHz "Prescott"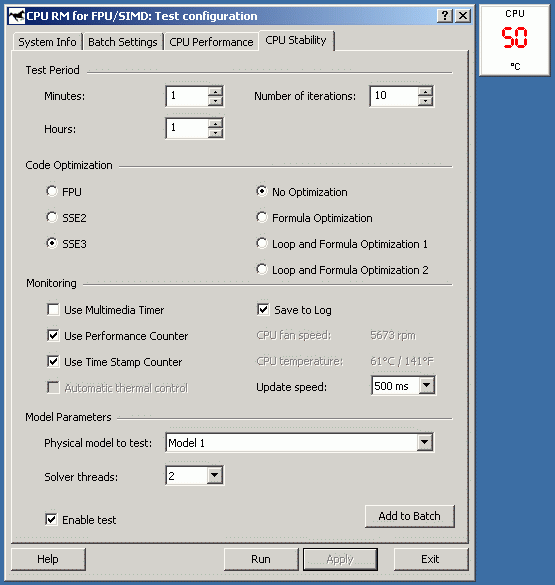 The first thing that catches the eye is Prescott's idle temperature. In our case it was 50°C against Northwood's 34°C. Of course, it was just one of the cases, but considering the absence of other changes in the testbed we believe we can make a correct conclusion about the relative difference between Prescott and Northwood temperature modes. 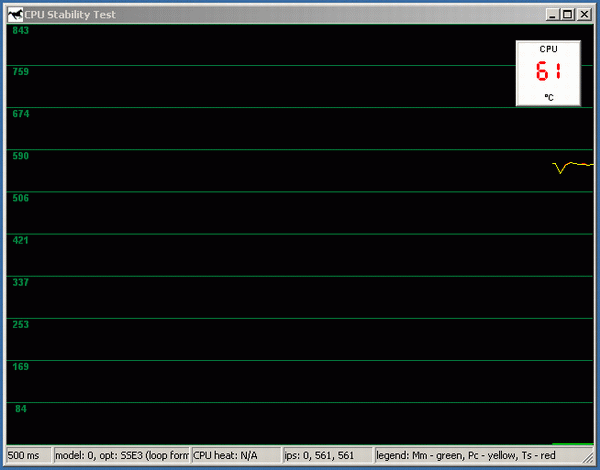 About 5 seconds after the test start. The temperature rises faster than in the case with Northwood: the speed is almost 2 degrees per second.  The temperature has stabilized at 76°C (against Northwood's 50°C). Now let's compare: Northwood has 34°C at idle against 50°C at a 100 percent loading, while Prescott has 50°C against 76°C. The difference is not in favour of Prescott. 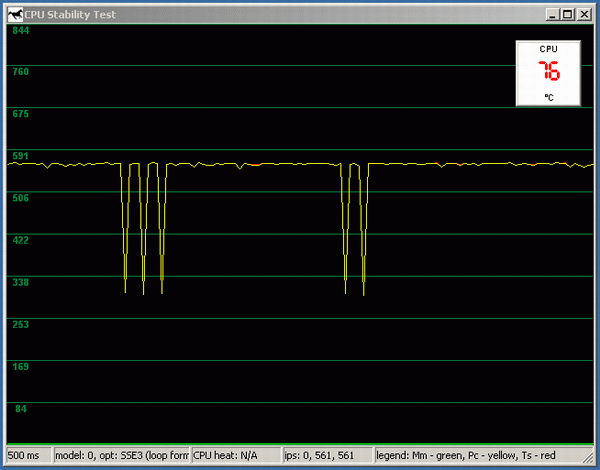 After screenshot capturing spikes appear in this graph as well, only much more frequent and profound. But in this case, it is harder to say what they suggest. It may be other processes interfering, or it may be a first sign of throttling. The latter variant is possible due to two reasons. First, spikes are very long, equal approximately to a 50 percent performance loss. The second reason will be seen from the commentary below. 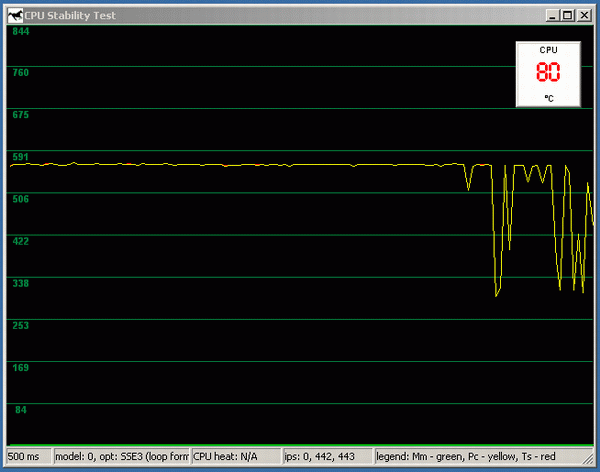 We powered off the fan. 5 or 6 seconds after, the temperature rises to 80°C and throttling with stick-slip performance changes begins. It is absolutely unlike the smooth Northwood performance fall we saw. Note also the difference in threshold between a normal operating temperature and throttling start. It is 74/50 for Northwood and 80/76 for Prescott. Thus, we can state that since the fan stop, Prescott reaches a first emergency situation a whole minute earlier than Northwood. 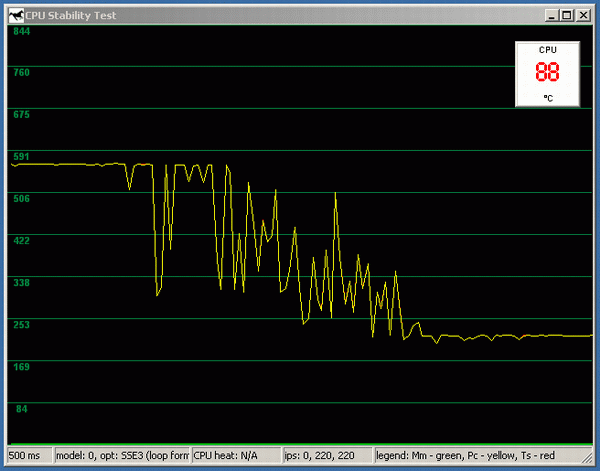 Another 6-8 seconds and the CPU goes into a full throttling cycle at 88-90°C. On the whole, the performance curve can still be called smooth, but the fluctuation amplitude is much bigger than in the case with Northwood. Here we would like to explain a frequent use of words denoting imprecision, such as "approximately", "around", "about" and the likes. The thing is that there's no sense in showing all the screenshots, as they are all similar. We only choose one, the most typical screenshot. And value intervals given in the article come as a result of the repeatedly conducted experiment. 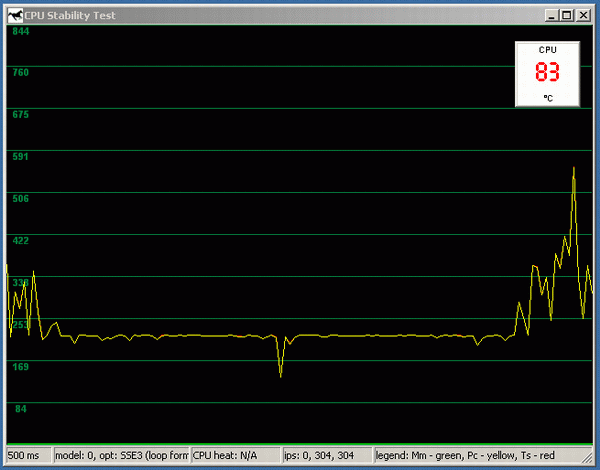 The fan is turned on. The first difference from Northwood is that nothing at all happens within 4 to 5 seconds. And it is only after this period that the temperature falls - quite abruptly, in 3-4 seconds - to 85-83°C, and CPU begins making efforts to escape throttling. On the diagram, the return to a normal functioning looks as saw-toothed as the throttling start (compare it to a smooth Northwood curve). 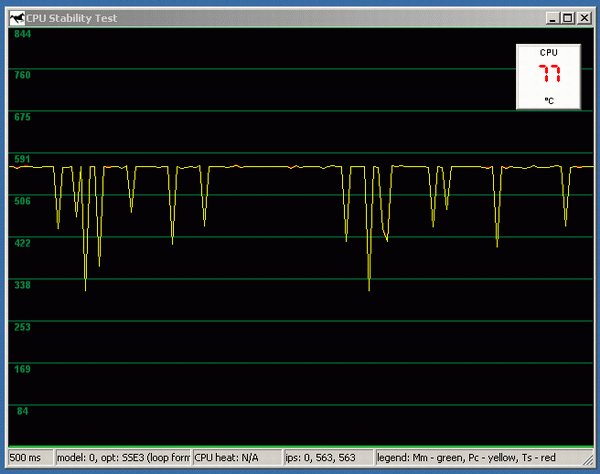 The left part of the graph reflects the first 30 seconds after the fan was turned on. It is clearly seen that even after performance has stabilized, the graph continues to have rather long jags now and then. This fluctuation goes on for about 2 minutes.  ...Then the temperature goes back to 76-77°C and the graph becomes flat. Throttling is over and the operating temperature is approximately the same as it was with the fan on. 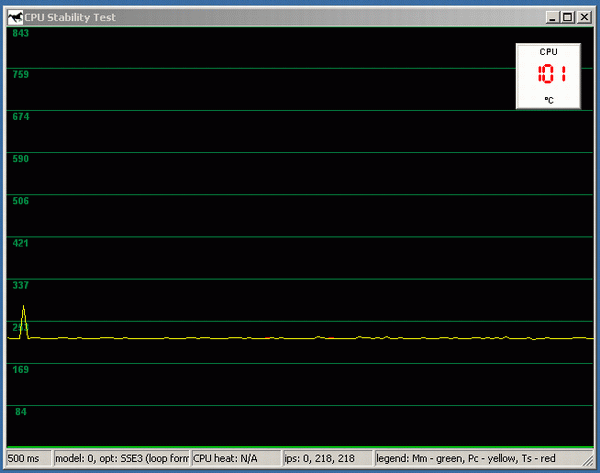 The system with a Prescott CPU shuts down at a higher temperature than that with a Northwood. The latter's peak was, in our case, 98°C, while Prescott never shut down at temperatures below 101°C, sometimes even working on at 105°C. ConclusionsNow let us sum up the results of our experiments.
|
Platform · Video · Multimedia · Mobile · Other || About us & Privacy policy · Twitter · Facebook Copyright © Byrds Research & Publishing, Ltd., 1997–2011. All rights reserved. |