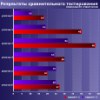
Performance ratings
Calculations are based on gaming, 3DMark and Unigine test results. The calculation method is described here.
You may have noticed our ratings have changed a bit. Now we only have two: capability and usability. The capability rating compares each graphics card with GeForce GT 430 which is considered a baseline, or 100%. The rating is based on both synthetic and gaming results and shows, as the name implies, what a product is capable of.
The usability rating is obtained by dividing each card's capability rating by its price. It basically shows whether a given product is over or underpriced, considering what it can do, and thus how reasonable it is to buy it.
Below are two tables sorted by different ratings.
Sorted by capability (high to low)
| # |
Card |
Capability rating |
Usability rating |
Approx. price, USD |
| 01 |
HD 7970 CF 2x3072MB, 925/925/5500 |
1180 |
126 |
940 |
| 02 |
GTX 680 SLI 2x2048MB, 1000–1100/6000 |
1180 |
108 |
1096 |
| 03 |
GTX 690 2x2048MB, 914–1014/6000 |
1120 |
107 |
1045 |
| 04 |
HD 7970 3072MB, 1180/1180/6000 |
890 |
182 |
490 |
| 05 |
GTX 680 4096MB, 1071–1200/6000 |
840 |
147 |
570 |
| 06 |
HD 7970 GHz 3072MB, 1050/1050/6000 |
790 |
161 |
490 |
| 07 |
GTX 670 2048MB, o/c 1100–1200/6600 |
790 |
185 |
426 |
| 08 |
GTX 680 2048MB, 1000–1100/6000 |
780 |
142 |
548 |
| 09 |
GTX 670 2048MB, 915–1030/6000 |
740 |
174 |
426 |
| 10 |
HD 7970 3072MB, 925/925/5500 |
720 |
153 |
470 |
| 11 |
HD 7950 3072MB, o/c 925/925/5500 |
700 |
197 |
356 |
| 12 |
GTX 660 Ti 2048MB, o/c 1100–1200/6400 |
700 |
215 |
326 |
| 13 |
HD 7870 2048MB, o/c 1150/1150/5500 |
640 |
228 |
281 |
| 14 |
GTX 660 Ti 2048MB, 915–1030/6000 |
640 |
196 |
326 |
| 15 |
HD 7950 3072MB, 800/800/5000 |
620 |
174 |
356 |
| 16 |
GTX 660 2048MB, o/c 1088–1190/6300 |
620 |
258 |
240 |
| 17 |
HD 7870 2048MB, 1000/1000/4800 |
560 |
199 |
281 |
| 18 |
HD 7850 2048MB, o/c 1020/1020/5600 |
550 |
248 |
222 |
| 19 |
GTX 660 2048MB, 993–1053/6000 |
530 |
221 |
240 |
| 20 |
HD 7850 2048MB, 860/860/4800 |
480 |
216 |
222 |
| 21 |
GTX 560 Ti 1024MB, 822/1644/4000 |
420 |
162 |
260 |
| 22 |
HD 6870 1024MB, 900/900/4200 |
390 |
181 |
216 |
| 23 |
GTX 560 1024MB, 810/1620/4000 |
370 |
186 |
199 |
| 24 |
GTX 650 Ti 2048MB, o/c 1033/1033/6200 |
370 |
209 |
177 |
| 25 |
GTX 650 Ti 2048MB, 928/928/5400 |
350 |
198 |
177 |
| 26 |
HD 6850 1024MB, 775/775/4000 |
330 |
127 |
260 |
| 27 |
HD 7770 1024MB, o/c 1120/1120/5200 |
320 |
241 |
133 |
| 28 |
HD 7770 1024MB, 1000/1000/4500 |
290 |
218 |
133 |
| 29 |
GTX 550 Ti 1024MB, 900/1800/4000 |
270 |
227 |
119 |
| 30 |
HD 7750 1024MB, o/c 950/950/5000 |
260 |
245 |
106 |
| 31 |
GTX 650 1024MB, 1110/1110/5000 |
250 |
191 |
131 |
| 32 |
HD 7750 1024MB, 800/800/4500 |
230 |
217 |
106 |
| 33 |
GT 640 2048MB, 900/900/1782 |
180 |
191 |
94 |
| 34 |
HD 6670 1024MB, 800/800/4000 |
150 |
172 |
87 |
| 35 |
HD 6570 1024MB 650/650/2000 |
120 |
200 |
60 |
| 36 |
GT 630 2048MB, 800/1600/1334 |
100 |
161 |
62 |
Sorted by usability (high to low)
| # |
Card |
Usability rating |
Capability rating |
Approx. price, USD |
| 01 |
GTX 660 2048MB, o/c 1088–1190/6300 |
258 |
620 |
240 |
| 02 |
HD 7850 2048MB, o/c 1020/1020/5600 |
248 |
550 |
222 |
| 03 |
HD 7750 1024MB, o/c 950/950/5000 |
245 |
260 |
106 |
| 04 |
HD 7770 1024MB, o/c 1120/1120/5200 |
241 |
320 |
133 |
| 05 |
HD 7870 2048MB, o/c 1150/1150/5500 |
228 |
640 |
281 |
| 06 |
GTX 550 Ti 1024MB, 900/1800/4000 |
227 |
270 |
119 |
| 07 |
GTX 660 2048MB, 993–1053/6000 |
221 |
530 |
240 |
| 08 |
HD 7770 1024MB, 1000/1000/4500 |
218 |
290 |
133 |
| 09 |
HD 7750 1024MB, 800/800/4500 |
217 |
230 |
106 |
| 10 |
HD 7850 2048MB, 860/860/4800 |
216 |
480 |
222 |
| 11 |
GTX 660 Ti 2048MB, o/c 1100–1200/6400 |
215 |
700 |
326 |
| 12 |
GTX 650 Ti 2048MB, o/c 1033/1033/6200 |
209 |
370 |
177 |
| 13 |
HD 6570 1024MB 650/650/2000 |
200 |
120 |
60 |
| 14 |
HD 7870 2048MB, 1000/1000/4800 |
199 |
560 |
281 |
| 15 |
GTX 650 Ti 2048MB, 928/928/5400 |
198 |
350 |
177 |
| 16 |
HD 7950 3072MB, o/c 925/925/5500 |
197 |
700 |
356 |
| 17 |
GTX 660 Ti 2048MB, 915–1030/6000 |
196 |
640 |
326 |
| 18 |
GT 640 2048MB, 900/900/1782 |
191 |
180 |
94 |
| 19 |
GTX 650 1024MB, 1110/1110/5000 |
191 |
250 |
131 |
| 20 |
GTX 560 1024MB, 810/1620/4000 |
186 |
370 |
199 |
| 21 |
GTX 670 2048MB, o/c 1100–1200/6600 |
185 |
790 |
426 |
| 22 |
HD 7970 3072MB, 1180/1180/6000 |
182 |
890 |
490 |
| 23 |
HD 6870 1024MB, 900/900/4200 |
181 |
390 |
216 |
| 24 |
HD 7950 3072MB, 800/800/5000 |
174 |
620 |
356 |
| 25 |
GTX 670 2048MB, 915–1030/6000 |
174 |
740 |
426 |
| 26 |
HD 6670 1024MB, 800/800/4000 |
172 |
150 |
87 |
| 27 |
GTX 560 Ti 1024MB, 822/1644/4000 |
162 |
420 |
260 |
| 28 |
GT 630 2048MB, 800/1600/1334 |
161 |
100 |
62 |
| 29 |
HD 7970 GHz 3072MB, 1050/1050/6000 |
161 |
790 |
490 |
| 30 |
HD 7970 3072MB, 925/925/5500 |
153 |
720 |
470 |
| 31 |
GTX 680 4096MB, 1071–1200/6000 |
147 |
840 |
570 |
| 32 |
GTX 680 2048MB, 1000–1100/6000 |
142 |
780 |
548 |
| 33 |
HD 6850 1024MB, 775/775/4000 |
127 |
330 |
260 |
| 34 |
HD 7970 CF 2x3072MB, 925/925/5500 |
126 |
1180 |
940 |
| 35 |
GTX 680 SLI 2x2048MB, 1000–1100/6000 |
108 |
1180 |
1096 |
| 36 |
GTX 690 2x2048MB, 914–1014/6000 |
107 |
1120 |
1045 |
Top solutions like Radeon HD 79xx and GeForce GTX 670/680/690 should only be considered in terms of their capability ratings, because they are made for enthusiasts willing to spend no matter how much to get the best performance.
For other graphics cards, price plays a more important role, and the lower the product category the more critical the price is. As of today, Radeon HD 7750/7770 are still in the lead, joined by Radeon HD 7850/7870. The top place in the Usability Rating is, however, occupied by the overclocked GeForce GTX 660. Note: Remember that for our calculations we assume that prices for regular and overclocked variants are the same. The reason is that 95% of graphics cards can be overclocked rather easily.
As of early December 2012, the GeForce GTX 660, GeForce GTX 550 Ti, and Radeon HD 7750/7770/7850/7870 cards are the best buy, offering the highest usability.
We express gratitude to AMD, ASUS, Chaintech, Corsair, Gainward, HIS, KFA2, MSI, NVIDIA, OCZ Technology, Palit, Sapphire Technology, Seagate, TUL (PowerColor), XFX, Zotac.
Write a comment below. No registration needed!
|
|
 |
|
|
|