Tests
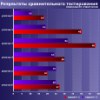
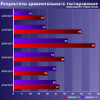
The primary test is to obtain a cross-load characteristic and draw it on a half-plane limited by the 3.3V&5V rail power on the Y-axis and the maximum 12V rail power on the X-axis. Each point of the graph is colored according to its deviation from the nominal value.
Color legend:
| Color |
Deviation scope |
Qualitative estimate |
| |
1% |
Excellent |
| |
2% |
Very good |
| |
3% |
Good |
| |
4% |
Satisfactory |
| |
5% |
Bad |
| |
>5% |
Poor |
Power supply quality is estimated according to test results, both across the total range and within a rectangle with coordinates (50,40) to (200,60). The latter is the operating range for home users.
Points are given based on the worst result (deviation), given that there are at least 3x3 dots of the same color. To calculate an integral rating, the points are summed up with the use of coefficients that reflect the importance of each voltage in a modern PC:
- 12V coefficient: 4x
- 5V coefficient: 2x
- 3.3V coefficient: 1x
The formula itself looks like:
Integral Rating = (E12xC12+E5xC5+E3xC3)/(C12+C5+C3)
Where E3, E5, E12 are the estimates of the 3.3V, 5V, 12V rails, and K3, K5, K12 are the coefficients.
Measured output voltage deviations:
| +3.3VDC |
+5VDC |
 
12V Power, W |

12V Power, W |
| +12VDC |

12V Power, W |
| |
3.3V |
5V |
12V |
Overall |
| Total range |
Good |
Good |
Very good |
3.57 (Good) |
| Operating range |
Very good |
Very good |
Very good |
4 (Very good) |
The range and stability of output voltages are good. There are no deviations over 3% within the measured power range, not even on the edges. At the same time, +12VDC rail deviations are within 2% which is a very good result.
Now we shall determine the actual PSU power -- power that this PSU will actually provide in a real PC, not just a testbed. This value is calculated by summing up the real peak power on the 12V rail and the 42W power on the 3.3V&5V rails. Given the voltage values are within bounds.
In today's case, the result was even slightly higher than the max. PSU power, so we considered the latter as the actual result. This is an excellent result.
Next, we shall measure total power supplied to the PSU and real power it consumed, and calculate the efficiency and power factors.
Average efficiency factor:
| Power range, W |
Value |
Estimate |
| Total |
83.5 |
Very good |
| 50-250 |
80.8 |
Good |
| 100-500 |
85.9 |
Excellent |
The average power factor across the total range is 95.2%, a typical result for an Active PFC model.
Noise
VShV-003-M3 sound level meter and A-weighting is used. The sound pressure sensor is located 90cm above the center of the test subject, which itself stands on a soundproof sheet of porous rubber. All tests are conducted in a soundproof room with the typical noise level of 20 dB(A). All electric appliances in the room are switched off during tests. Note that we do not assume that manufacturers conduct their own tests under similar conditions.
At typical power the noise level is below average. As power grows the PSU becomes noisier, but the general result is very good.
Conclusions
XFX positions P1-650X-CAG9 as a gamer solution, but of course you can use it in any high-performance machine of adequate power consumption. It's probably not the best in terms of technical specifications, but it's quite good nevertheless -- thanks to the OEM platform, the tuning and high-quality parts.
On the downside, ATX12V/EPS12V cables could be longer and the number of SATA connectors could be higher.
If you want to buy P1-650X-CAG9, remember that it's 170mm long and another 12mm will be required for cable connectors.
Write a comment below. No registration needed!