 |
||
|
||
| ||
|
||
|
||
| ||
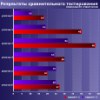
Frame CaptureFrame Capture allows to capture and save all data in separate frames and receive data from test computers running GPA server side. 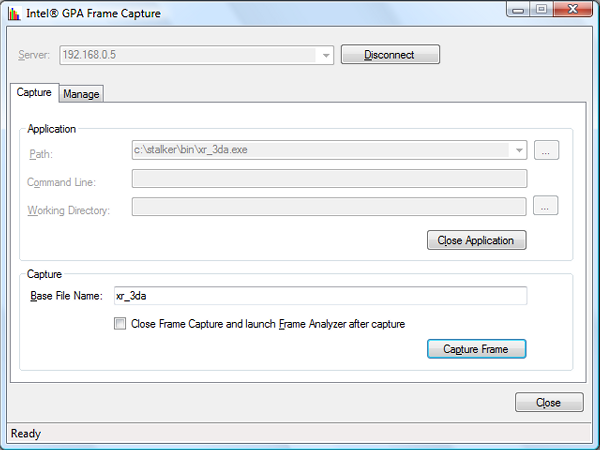 To capture one or several frames with GPA Frame Capture, run GPA Remote Server on the test system and then run GPA Frame Capture on the computer that will perform the analysis. Specify the IP address of the target computer, connect to the server side, and choose an application to run on the test system. Then press the Capture Frame button to capture and save separate frames to be analyzed in GPA Frame Analyzer. Frame Capture provides convenient management for files with captures frames. All captured and saved frames will be listed on the Manage tabbed page. You can rename, delete, and save them to the local computer running GPA Frame Capture. That's about it. This is an important utility, but developers will spend most of the time in the next utility analyzing frames. Frame AnalyzerFrame Analyzer is an important component of the package, probably even the most important. The key advantage of this utility is its interactivity, which allows developers to profile GPUs in their applications. Besides, programmers get an opportunity for various experiments and performance analysis. GPA Frame Analyzer works with frame data captured with System Analyzer or Frame Capture. A file saved by these programs contains all necessary information about draw calls and their order during rendering. This utility is a client side, which connects to the server side running on the test computer (via network or locally). At first the client and the server exchange frame data. Then Frame Analyzer rerenders a scene and gathers detailed information on performance. As you conduct experiments and make changes (shaders, render states, etc), the utility shows a performance difference between the original and modified frames for each draw call and for a whole frame. 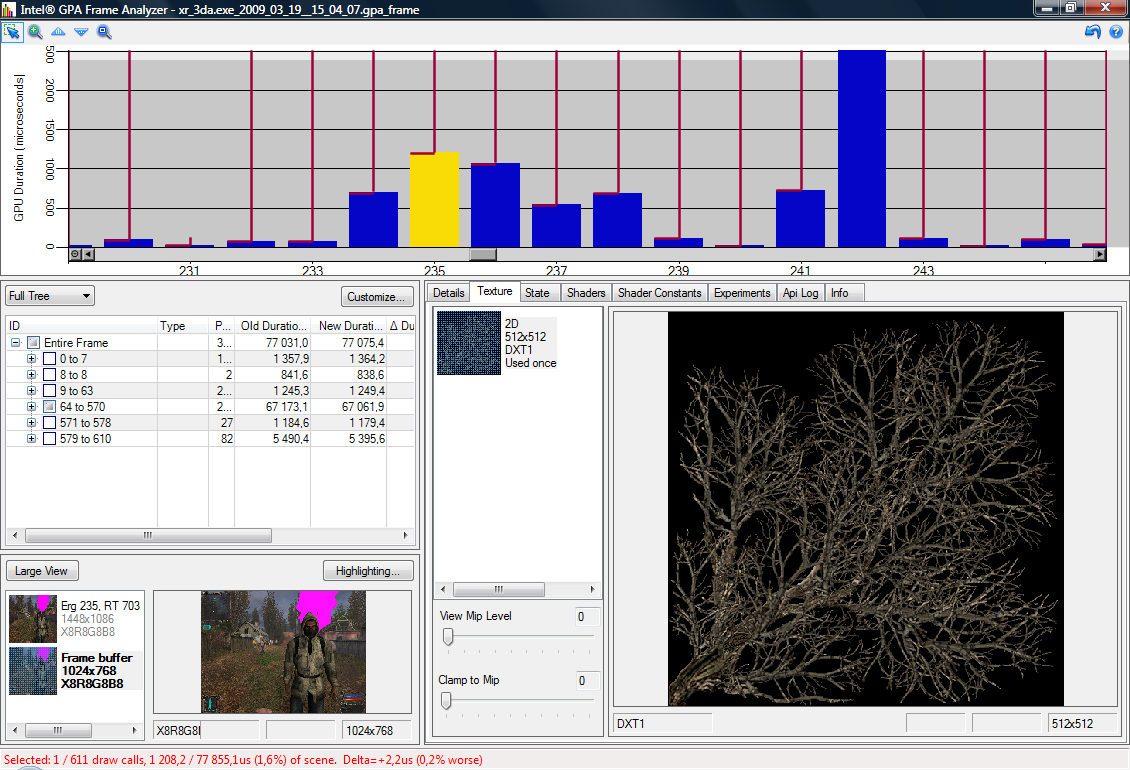 That's how a developer works with this program: a captured frame is loaded into Frame Analyzer, analyzed, bottlenecks are detected. Then a developer performs various experiments, changes render states, shader code, etc, finding ways to improve performance. But it only looks simple. In fact, this process is the heart of optimizing a 3D application -- to find and possibly eliminate parts of code that consume the most resources. And such packages as Intel GPA make programming much easier. Let's take a look at some of the opportunities provided by frame analysis. Frame Analyzer will help you learn the time spent on certain parts of a scene. Each of these fragments consists of some D3D calls, they are displayed on the main graph. The diagram makes it easy to find segments that require most time to process. The higher the bar, the more time it takes to execute a given draw call. So it needs more time to spend on its optimizations. Besides, you can run some experiments (override modes), like in System Analyzer, but for any draw call. That is, you can apply any of the available override modes (2x2 Textures, 1x1 Scissor Rect, Simple Pixel Shader) or all at once either for one draw call or for several selected ones, which give you much flexibility. 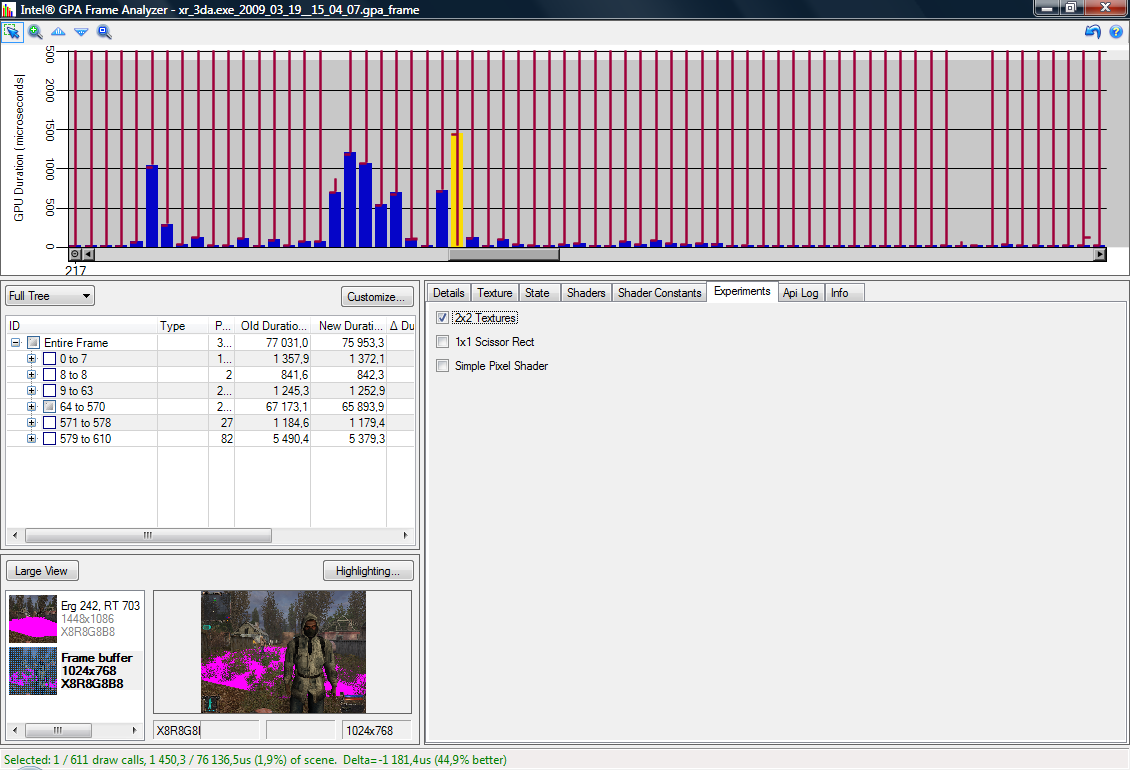 Override modes work just like the ones described above, they modify rendering to separate one of the pipeline stages to detect bottlenecks. Modifications are introduced by the video driver, so an application does not detect any changes. As in case with System Analyzer, if one of the modes significantly raises performance, that very stage of the 3D pipeline slows an application down. We've already examined all modes above, they work in the same way here. You can also modify DX states. If a scene is not rendered correctly, you can try and change some of the states to see how the modified state affects the final result. You can change render states, sampler states, etc. It's also very convenient to edit shaders. Code modifications help you see which segment limits performance and make optimizations easier -- you can edit shader code and immediately see the result, whether render times got better or not. 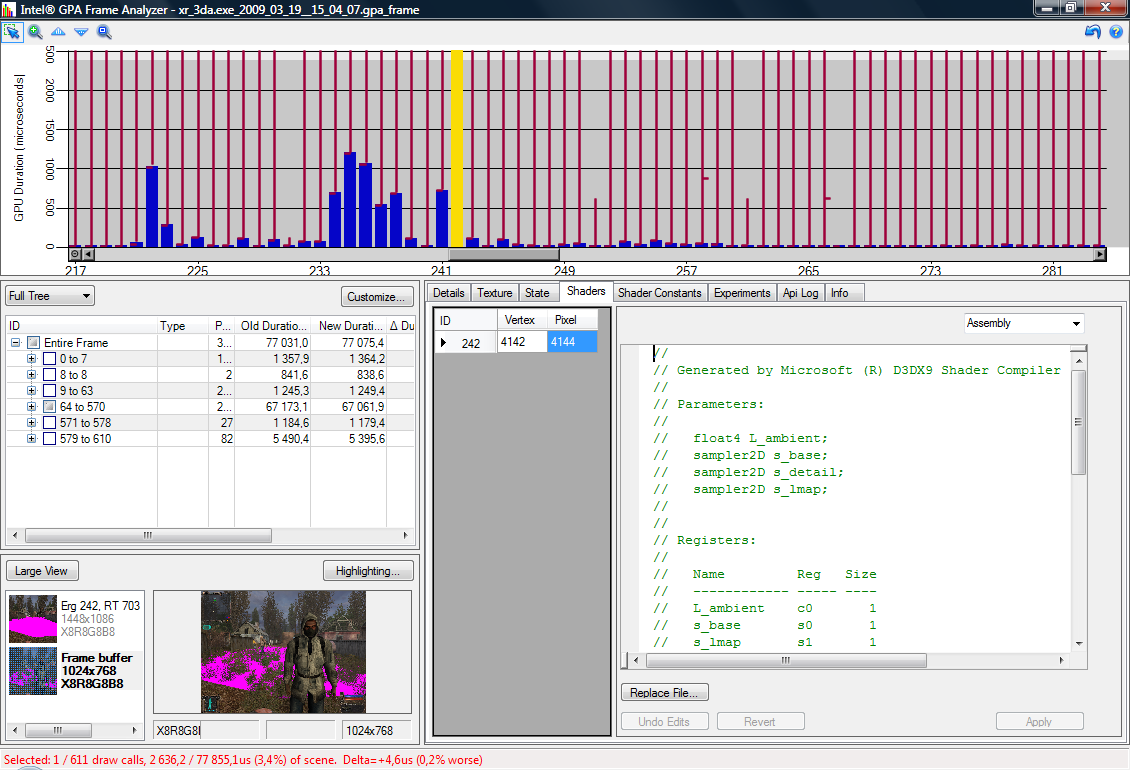 There are three options to substitute shader code: choose a new source, manually edit in Frame Analyzer, and insert code from clipboard. All modifications remain in force even with the next draw calls. The code remains modified until you press the Revert All Changes button in the main window to return to the original code. Frame Analyzer can be used to detect calls with the highest requirements to texture memory bandwidth. Just select necessary frame fragments and restrict them to using the lowest MIP levels of textures with the Clamp to Mip slider. The scene will redraw with a lower detail level, and you will be able to evaluate the change in render times. If this change raises performance significantly, it's texture memory bandwidth that limits the render speed. This feature is also useful, when you determine the optimal texture size, as you can see immediate changes on a rendered frame. We can say that Frame Analyzer is a very convenient tool for debugging and optimization of Direct3D applications. Developers of graphics applications, games in particular, see at once what draw calls require more time. They can see the textures, draw buffers, shader code, and all Direct3D calls in a frame. What's important, Frame Analyzer allows to perform various experiments on the fly and get immediate results from editing shaders, changing texture mip-levels and DX states. It all happens in real time and is presented in a convenient form. SDK and APILet's say a few words about Software Development Kit (SDK) that comes with GPA. This kit helps developers use GPA utilities as they want. SDK allows to use metrics from custom applications, be it 3D programs or utilities to test 3D performance. GPA Core Services API is used to profile graphics applications. It provides the following features: start and stop GPA, start a 3D application for analysis and profiling, gather data from GPU, CPU and D3D metrics, override modes, error handling, etc. SDK comes with necessary libraries, includes, and several API usage samples. ConclusionsIntel Graphics Performance Analyzer offers very convenient utilities to debug 3D applications, to detect bottlenecks, and to optimize code. This package makes it easy to evaluate the effect of each part of the graphics pipeline on the overall performance and optimize problem places you found. It's much easier to find such places with GPA functions. Besides, software and hardware metrics provide important information how a test system works in a given 3D application. This SDK also allows to use GPA functions from custom applications. The bundle already includes ready tools to analyze Direct3D applications working in real time. GPA differs from similar utilities in some features -- for example, convenient options to modify shader code, render states, and texture mip-levels in real time. The client-server organization is very convenient for testing full-screen applications running on a test computer with an auxiliary system used for analysis. What's important, these utilities work without modifying the original code of the tested program, unlike some utilities from other manufacturers. Besides, it can boast of a really convenient customizable user interface. Unfortunately, this package also has some drawbacks. It supports only D3D9 applications for now, the next versions will be supported only in future releases. But the main drawback of this package is hardware restrictions. Integrated chipsets have never been very fast, so not all developers will want to use such systems, unless hardware requirements of their applications demand it. But even now GPA allows developers to optimize their applications for integrated graphics from Intel. In future, GPA will support all graphics products from Intel, most likely including the notorious Larrabee. Future versions of GPA promise to add interesting and even unique changes, which may come in handy to developers. So it makes sense to start using GPA 2.0 now, to ensure painless transition to higher-performance systems and more functional versions of this suite. Bottom line. Developers of modern 3D applications using Direct3D API will find Intel Graphics Performance Analyzer very useful. Utilities from this package will help them solve many difficult questions arising in the process of 3D development: detecting bottlenecks and render mistakes, optimizing GPU and CPU usage, and many others. Write a comment below. No registration needed!
|
Platform · Video · Multimedia · Mobile · Other || About us & Privacy policy · Twitter · Facebook Copyright © Byrds Research & Publishing, Ltd., 1997–2011. All rights reserved. |