NVIDIA GeForce GTX 260 896MB
|
Performance in games
Testbed
- Intel Core2 Extreme QX9650 (3000 MHz) CPU
- Zotac 790i Ultra motherboard on NVIDIA nForce 790i Ultra
- 2GB DDR3 SDRAM Corsair 2000MHz (CAS (tCL)=5, RAS to CAS delay (tRCD)=5, Row Precharge (tRP)=5, tRAS=15)
- WD Caviar SE WD1600JD 160GB SATA hard drive
- Tagan TG900-BZ 900W PSU
- Windows Vista 32bit SP1, DirectX 10.1
- Dell 3007WFP 30-inch monitor
- ATI CATALYST 8.5; NVIDIA Forceware 175.16 (9xxx series) and 177.34 (GTX 280)
- VSync disabled
Benchmarks
- Call Of Juarez (Techland/Ubisoft) - DirectX 9.0, Shaders 3.0 (HDR), maximum quality settings; demo, batch file included.
- S.T.A.L.K.E.R. 1.003 (GSC Game World/THQ) - DirectX 9.0, maximum quality settings (dynamic lighting enabled); demo, copy files to the savegames folder, run the game, load level 'ixbt3', and type "demo_play ixbt3" in the console.
- 3DMark Vantage 1.00 (FutureMark) - DirectX 10.0, Shaders 4.0, multitexturing, 'Extreme' settings.
- CRYSIS 1.2 (Crytek/EA), DirectX 10.0, Shaders 4.0, 'Very High' settings, levels 'Rescue' and 'Harbor'; batch file, e-mail us to obtain the timedemo. We express gratitude to CRYTEK for creating a timedemo for iXBT.com / Digit-Life.
- Company Of Heroes Opposing Fronts (Relic Entertainment/THQ) - DirectX 10.0, Shaders 4.0, maximum quality settings; batch file, run the game, invoke graphics settings and click the test button.
- World In Conflict 1.007 (Massive Entertainment/Sierra) - DirectX 10.0, Shaders 4.0, 'Very High' settings with adjusted AA and AF; run the game, invoke graphics settings and click the test button.
- 3DMark06 1.10 (FutureMark) - DirectX 9.0c, multitexturing, 'Trilinear' settings.
Note that performance charts are located on a dedicated page, because they don't fit a reasonable resolution.
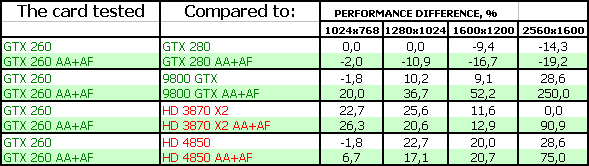
S.T.A.L.K.E.R.
Performance charts: S.T.A.L.K.E.R.
As we can see, the GTX 260 card performs right in between the 9800 GTX and GTX 280 cards. Considering the great power of the X2, the new product is defeated.
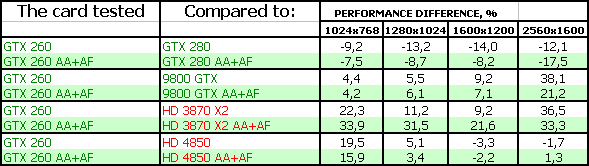
World In Conflict
Performance charts: World In Conflict
This game clearly shows optimizations in the engine or in NVIDIA drivers. The game apparently favors products from this Californian corporation. The GTX 260 card comes closer to the GTX 280 than to the 9800 GTX in performance.
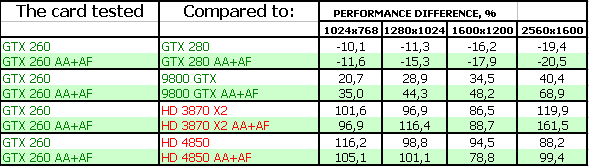
CRYSIS, Rescue, DX10, Very High
Performance charts: CRYSIS, Rescue, DX10, Very High
This situation is more pleasant for the new card. The GTX 260 again performs in between the GTX 280 and the 9800 GTX. It outperforms the X2 card here, which has apparent problems with CrossFire.
CRYSIS, Harbor, DX10, Very High
Performance charts: CRYSIS, Harbor, DX10, Very High
A similar situation.
Call Of Juarez
Performance charts: CoJ
This game demonstrates finetuned CrossFire operation, so the X2 card easily outperforms the new product, which still demonstrates average results in between the GTX 280 and the 9800 GTX.
Company Of Heroes
Performance charts: CoH
A similar situation.
3DMark Vantage: Graphics MARKS
Performance charts: 3DMark Vantage: Graphics MARKS
In fact, it's a similar situation again. The GTX 260 becomes a leader in its group, it's 20% as slow as the GTX 280, but it outperforms the 9800 GTX by 66-70%.
3DMark06: SHADER 2.0 MARKS
Performance charts: 3DMark06 SM2.0 MARKS
Nobody optimizes programs for these shaders anymore, so the situation is diverse and sometimes vague. This spread of results again proves the fact that the distinct picture of victories and defeats can be seen ONLY after adding optimizations to the drivers and software. No optimizations, no truth to find.
3DMark06: SHADER 3.0 MARKS
Performance charts: 3DMark06 SM3.0 MARKS
Shaders 3.0 are still used in games, so developers add optimizations for them, and the situation changes cardinally. The GTX 260 card performs in between its competitors, as before. It's also defeated by the X2, which enjoys all optimizations in this test.
Write a comment below. No registration needed!
|
|
 |
|
|
|